Press enter or space to select a node. You can then use the arrow keys to move the node around. Press delete to remove it and escape to cancel.
Press enter or space to select an edge. You can then press delete to remove it or escape to cancel.
Knowledge
Baseline establishes the comparison point
The 124.4M-parameter transformer reaches a validation loss of 2.824 on WikiText-103. All three variants use the same validation set and training budget.
Sources
FigureBaseline training curve
Training loss decreases over the fixed training budget.
Train 125M transformer
Find three ways to improve this transformer and test them in parallel.
The baseline is trained. I’ll compare three improvements on the same validation set:
RoPE + longer context
LR warmup + weight tying
SwiGLU + RMSNorm
Each agent will train its variant and record the results in the task map.
Qualia supports every step of the research process.
FileEditSelectionViewGoRunHelp
TAM Research
TasksKnowledgeKernels
01_load_tam.ipynb08_benchmark.ipynb
02_profile.ipynb
04_deduplicate…
Python 3
TAM dataset
Load, clean, and validate the total addressable market data.
[1]
import polars as pl
from pathlib import Path

source = Path("data/tam_companies.csv")
tam = pl.scan_csv(source)
tam.select(pl.len()).collect()
Lazy execution, parallel joins, and a reusable Parquet pipeline.
Code+ Markdown
Illustrative workflow: load the TAM dataset, coordinate eight agents, prepare data in Python notebooks, and compare a 62-second pipeline against a 192-second baseline. Dataset and benchmark values are simulated.
Process and work with data
Unify diverse datasources across files, datasets, and the web. Qualia autonomously cleans and preprocesses them.
Build recurring pipelines
Run workflows on a schedule to generate live reports, refined by feedback after every run.
Build and train ML models
From linear regression to deep networks, or post-train 10B-parameter foundation models on your data.
FileEditSelectionViewGoRunHelp
Housing Research
TasksKnowledgeKernels
baseline.ipynb
Tasks
Tasks
MapLensTimeline
Show knowledgeColor by metricNew task
Experiment coordinator
Establish the baseline
T-demo00000000
Prepare the dataset and establish a reproducible baseline for all experiments.
Run the experiment on the agreed split and capture the comparison in quality.ipynb.
FindingsCompared on the fixed validation split.▸ Figure: Experiment diagnostics
Gradient boosting
In progress
Compare learning rates
T-demo00000002
Run the experiment on the agreed split and capture the comparison in boosting.ipynb.
FindingsCompared on the fixed validation split.▸ Figure: Experiment diagnostics
Random forest
In progress
Tune depth and leaf size
T-demo00000003
Run the experiment on the agreed split and capture the comparison in forest.ipynb.
FindingsCompared on the fixed validation split.▸ Figure: Experiment diagnostics
Neural networks
In progress
Explore network architectures
T-demo00000004
Run the experiment on the agreed split and capture the comparison in neural.ipynb.
FindingsCompared on the fixed validation split.▸ Figure: Experiment diagnostics
Feature engineering
In progress
Test new feature combinations
T-demo00000001
Run the experiment on the agreed split and capture the comparison in features.ipynb.
FindingsCompared on the fixed validation split.▸ Figure: Experiment diagnostics
Spatial features
In progress
Test geographic context
T-demo00000012
Run the experiment on the agreed split and capture the comparison in spatial.ipynb.
FindingsCompared on the fixed validation split.▸ Figure: Experiment diagnostics
Ensembling
In progress
Combine independent models
T-demo00000008
Run the experiment on the agreed split and capture the comparison in ensemble.ipynb.
FindingsCompared on the fixed validation split.▸ Figure: Experiment diagnostics
Regularization
In progress
Test regularization strategies
T-demo00000007
Run the experiment on the agreed split and capture the comparison in regularization.ipynb.
FindingsCompared on the fixed validation split.▸ Figure: Experiment diagnostics
Feature ablation
In progress
Isolate useful features
T-demo00000006
Run the experiment on the agreed split and capture the comparison in ablation.ipynb.
FindingsCompared on the fixed validation split.▸ Figure: Experiment diagnostics
Cross-validation
In progress
Check stability across splits
T-demo00000011
Run the experiment on the agreed split and capture the comparison in validation.ipynb.
FindingsCompared on the fixed validation split.▸ Figure: Experiment diagnostics
Calibration
In progress
Check prediction calibration
T-demo00000009
Run the experiment on the agreed split and capture the comparison in calibration.ipynb.
FindingsCompared on the fixed validation split.▸ Figure: Experiment diagnostics
Error analysis
In progress
Inspect model failure cases
T-demo00000005
Run the experiment on the agreed split and capture the comparison in errors.ipynb.
FindingsCompared on the fixed validation split.▸ Figure: Experiment diagnostics
72%
Illustrative workflow: twelve agents receive instructions through the app’s To Agent chat rows, then their experiments appear in the task map. Content and timing are simulated; the layout follows the cloud app.
Explore and test new ideas
Fan out agents to test features, architectures, and training strategies in parallel. Diagnose model failures and run the follow-ups.
FileEditSelectionViewGoRunHelp
Housing Research
TasksKnowledgeKernels
housing_report.qua
validation.ipynb
WRITEUP · 3 MIN READ
What improves housing predictions?
An evidence-backed review of the experiment campaign
Summary
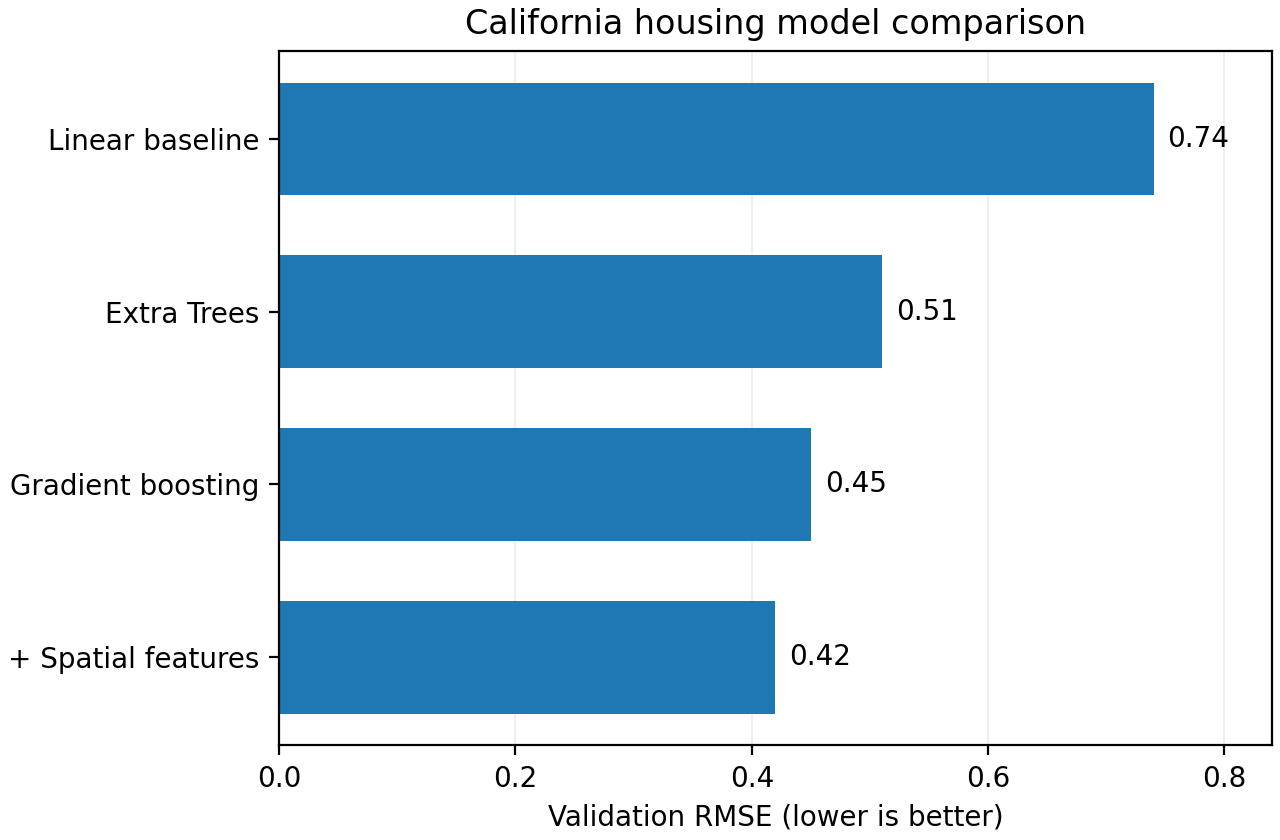
Nonlinear models improve on the linear baseline. Adding spatial context reduces validation error further, from 0.45 to 0.42.1
Validation RMSELower is better
Illustrative results · same validation split
Figure 1. Model comparison on a fixed validation split.2
What explains the improvement?
The feature ablation points to urban-distance features as a useful source of spatial context.3
Limitations
These results use one validation split. A held-out regional evaluation is needed before drawing broader conclusions.
Illustrative workflow: synthesize experiments into a writeup with figures and limitations, inspect a linked claim, and trace it to the notebook output behind the conclusion. Data and timings are simulated.
Write up and share your results
Create publication-ready papers and writeups that clearly summarize research, then share them and collaborate in chats.
Work autonomously
Give Qualia a research goal and let it work for hours, with progress updates in Slack to steer it.
Why Qualia works
Coordinates dozens of research agents.
Qualia breaks research goals into focused experiments that agents work on in parallel. Agents share findings and can investigate each other’s results, using what they learn to guide the next experiments.
Research accumulates across sessions.
Qualia remembers your experiments, findings, and assumptions in a shared knowledge graph that persists across sessions. Agents build on what worked and what failed, connecting insights across your research to propose creative new ideas.
Traceable.
Everything the agent does or says has provenance and is traceable to a query or line of code. You can inspect the evidence behind each finding and follow the steps that led to it.
A beautiful UI that runs wherever you are.
Qualia is built on primitives that run on any platform — desktop, Linux cluster, or in the cloud. It runs as an agent that manipulates Jupyter notebooks, or as a headless terminal agent.
Infinite possibilities
Posttraining
Qualia can posttrain large LMs, intelligently understand where they are failing, and improve. Run it on Qualia Cloud to take advantage of our pool of GPUs, or use standard libraries like Tinker or Fireworks.
Biotech
Qualia can preprocess large amounts of multiomics data, build repeatable, auto-improving data pipelines, and autonomously fit interpretable models over it. Use Qualia’s writeup feature to build clear, publishable reports. Qualia is HIPAA-compliant and can be run in ZDR mode.
Quantitative finance
Qualia helps you explore alternative datasets, test trading hypotheses in parallel, and understand where your models fail. Work with your existing data and code to run backtests, investigate results, and propose follow-up experiments, with every finding traceable to the analysis behind it.
Data science
Qualia works with your existing data and models to understand where predictions fail, discover useful features, and run experiments to improve them. You can delegate data preparation, feature engineering, and model iteration to coordinated agents that record their findings in a reproducible knowledge graph.
Research together in Qualia Cloud
Run experiments with cloud compute in your browser, and bring your team into the same research workspace. Share notebooks, agent conversations, and evidence. Teammates can comment on findings and ask Qualia questions about the research.
app.quadrillion.cloud
FileEditSelectionViewGoRunHelp
Housing Research
TasksKnowledgeKernels
validation.ipynb
Knowledge
Python 3
California housing
Compare models. Understand what makes a difference.
People you add can view everything in this workspace but can’t change anything. Commenters can also leave comments.
Add people by emailrichard.zhu@quadrillion.aiAdd people by email
ViewerCommenter
●Viewer
Commenter
Share
People with access
YouOwner
PPatrick YangCommenter
RRichard Zhurichard.zhu@quadrillion.aiCommenter
General access
RestrictedOnly people you add can open this workspace.
Done
Illustrative collaboration preview: share a cloud workspace with Richard as a Commenter, then Robbie, Richard, and Patrick discuss a shared notebook and ask Qualia about the results. The multi-person chat previews UI in development; messages and research data are fictional.
Need Qualia for enterprise? Qualia Enterprise provides your organization with additional capabilities, security and control. Learn about Qualia for Enterprise ↗